It’s up! I finally went ahead and put Helena on the Web Store - for free, of course. You can find it here. Now to be clear, it’s there, but it’s unlisted. That means you can find it if you have the link, but you won’t see it any search results. (The main reason is that Helena relies on a centralized server, and I don’t want to run up a crazy AWS bill just at the moment. That said, I’ll probably make the Web Store listing fully public eventually.) Even though it’s unlisted, you can always find its Web Store link from Helena’s own installation webpage: http://helena-lang.org/install.
If you’re looking to run some Helena programs headlessly, or if you want a fast way to get Helena installed on a remote machine, you’re probably going to want to use the Docker image. It’s all available on github: https://github.com/schasins/helena-docker. Just check out the README for a quick start guide. The Docker image can’t currently run parallelized Helena programs, but I’ll be adding support for that pretty soon, so stay tuned. (In the short term, if you need to run a parallelized program, there’s a utility script for that.) If you’re looking to do large-scale scrapes or automation tasks, you should definitely consider taking the Docker route. And don’t worry, if you still want to install Helena yourself and run it with the old utility scripts, I’ll keep those around.
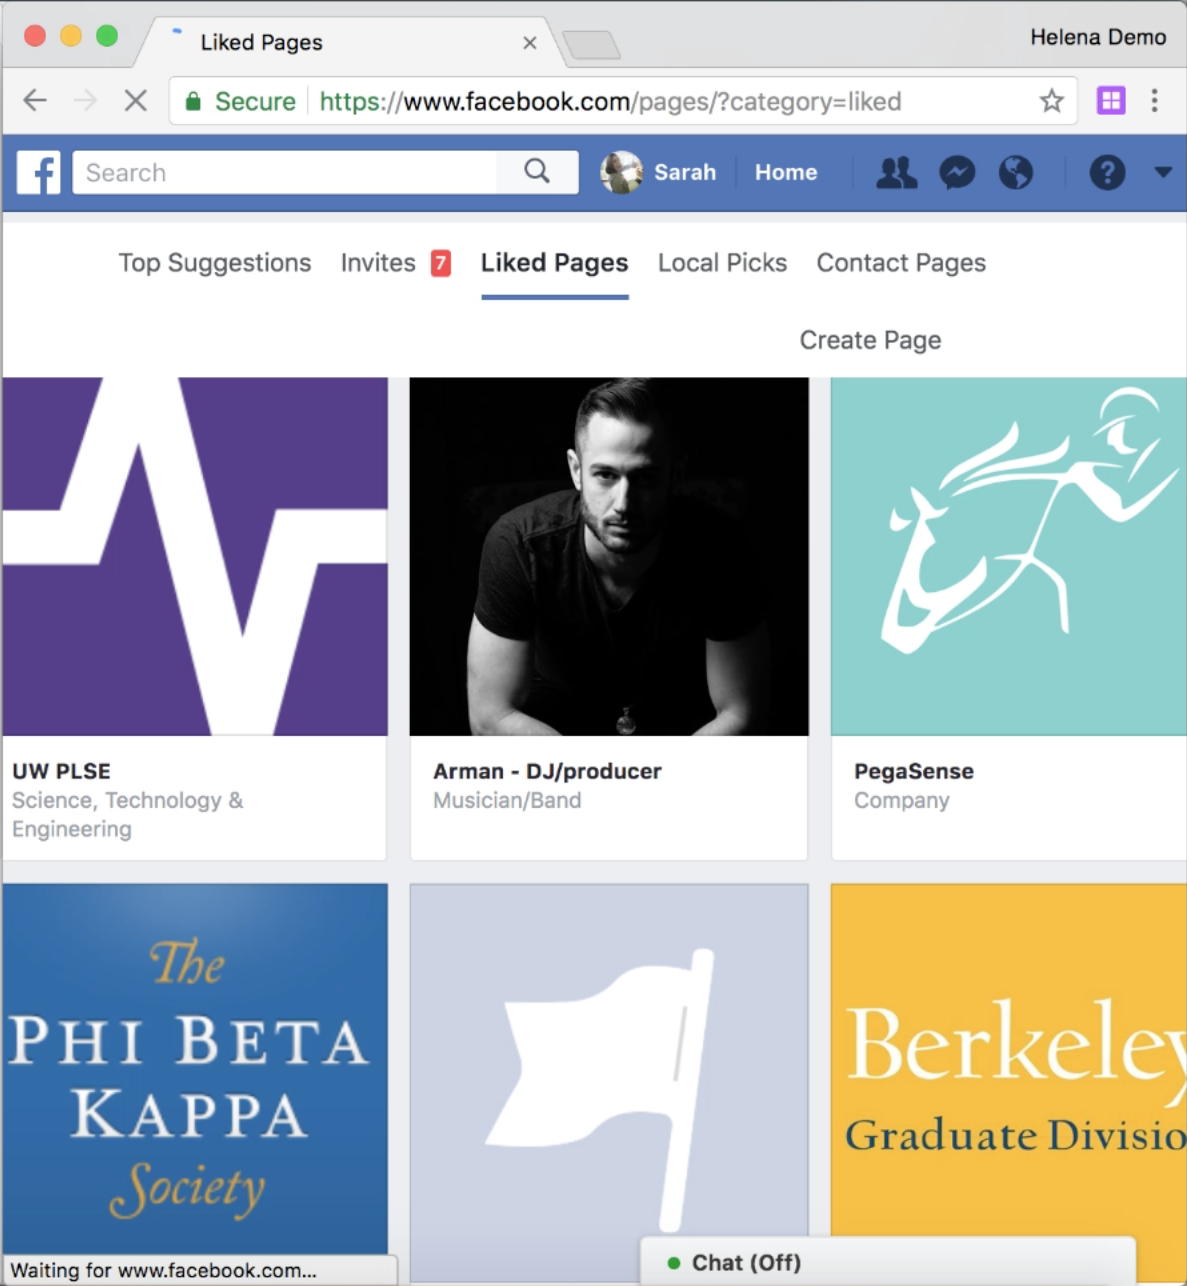
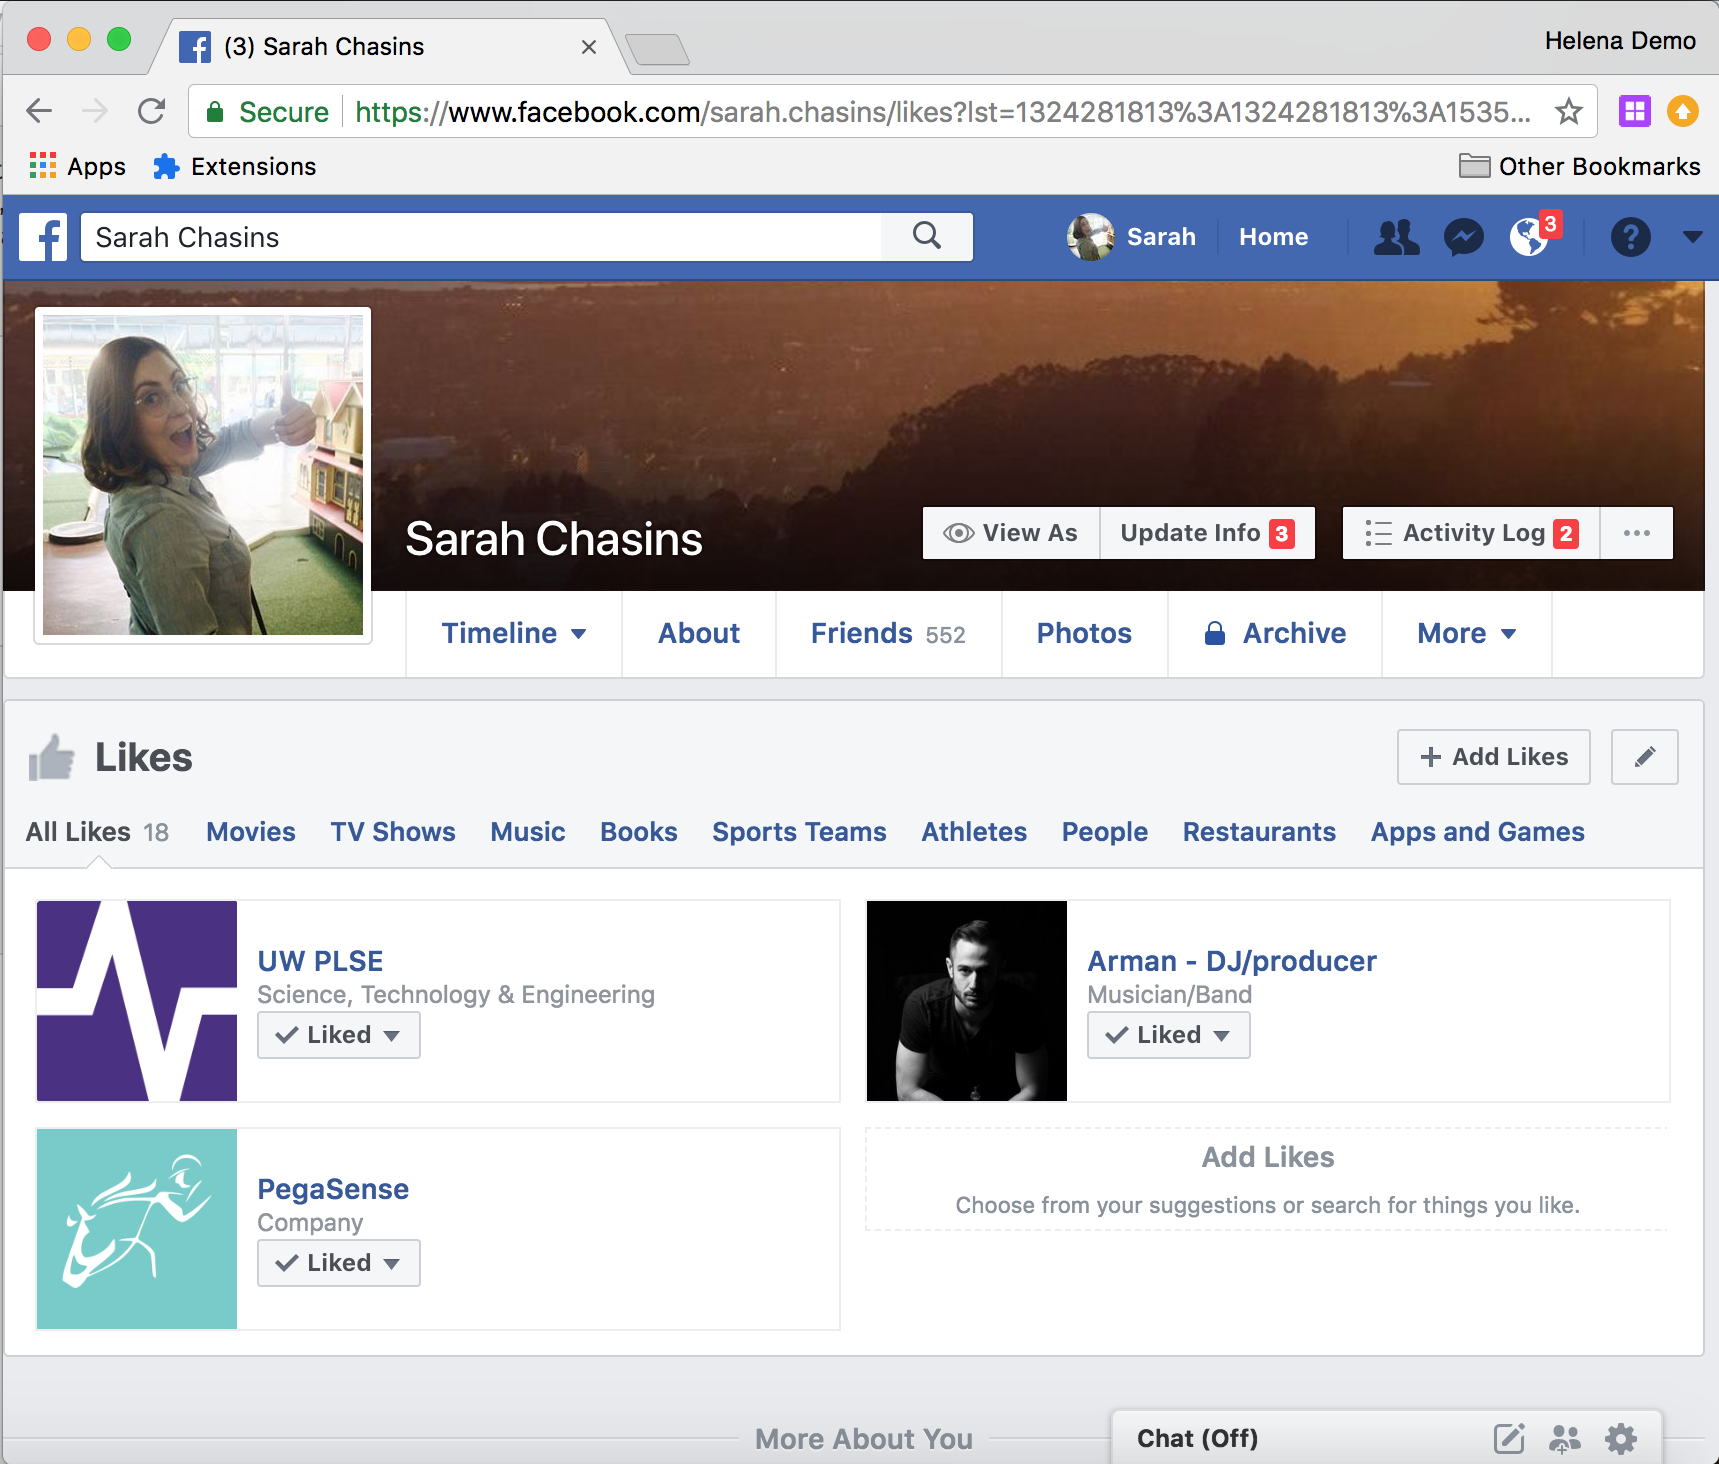
]]>Turns out Facebook doesn’t seem to love people doing this. I couldn’t find an unlike-all button. I couldn’t even find a list where I could unlike items from the list page. As far as I could tell, I had to just click on each liked item to load its page, find where Facebook shows that I ‘like’ it on that page, hover over that element, then unlike it.
I made it through about six of these pages before I thought to myself, “What am I doing? This is extremely annoying, it’s taking forever, and I’m the author of a web automation tool that could automate this in under a minute.” So I automated it. Here’s how the process goes, using Helena to automatically unlike all my Facebook likes:
Note that at the end there, when I refresh the webpage, the items that Helena unliked have disappeared from my list of likes.
As you can see in the GIF, by the time I recorded the unliking process for this blog post, Facebook was showing me a different version of the likes page, which included ‘unlike’ buttons on the list page. Much more convenient. But back when I originally did this (that’s right, the things I’m unliking here are dummy likes - you never get to know the random things I liked as a teen!), the page that listed likes looked like the page on the left below:
(And this is why you should write all your web automation programs with programming by demonstration, not by hand. Because wouldn’t I be sad if I spent an hour writing an automator for the old version, just to have them change the page a week later and make my program obsolete? Not that I plan to like a bunch of new things and do a fresh purge in future, but my friends do seem interested in unliking their own youthful follies.)
Anyway, the new process, now that we can unlike things from the list page goes like this:
The only difference is this time we’re using that handy ‘unlike’ button on the list page, so we don’t have to follow the link to the liked page, then unlike it there. Still just as easy to do with Helena, but boy is it annoying to do by hand. Or maybe I just had too many ‘likes.’ That might be the real root of the problem.
The takeaway here is that web automation isn’t limited to scraping. Scraping is a domain in which people tend to want to automate extremely large tasks, and improvements in scraping technology can help a diverse audience of social scientists and data scientists to tackle new problems, so making web automation tools perform well for realistic scraping tasks is deeply valuable. But there’s also a whole world of other automation tasks out there. Want to download a large set of PDFs? Want to try out a whole bunch of coupon codes before you check out? Want to untag yourself from a bunch of social media posts or photos? Want to copy a bunch of papers from a spreadsheet into a web interface? Want to ‘heart’ every tweet that uses a particular phrase? Consider web automation!
I ran into the same kind of scenario again just a couple days later, interacting with a conference management website. I’d bulk-uploaded PC members into HotCRP, but they’d all been listed as ordinary users without the PC designation. I couldn’t figure out a way to use the website to change multiple users’ PC designations at once - I found some kind of ‘Bulk Update’ link, but it seemed like the way to use it was to upload a fresh CSV with some arcane and undocumented tags attached to each user. So I just used Helena. I did a demonstration on the first user: clicked on the link to the user’s profile, clicked on the “PC Member” checkbox, then clicked on the “Save” button to save changes to the profile. Then I let Helena do the updates for the rest of the members. Here’s how it looks on HotCRP’s test conference site:
Fun fact, if you’re not careful, you might run the ‘change role to PC Member’ program on your own account, which will downgrade you from your chair/admin role, and then you won’t have the permissions to change yourself back! So here’s a fun chance to show off that we can edit our Helena programs via the blocks-based editor. Here we do the same demonstration, get the same program back from the synthesizer, then change the program to skip over users with “A L” in their names (and thus skip over the second user in the list):
In conclusion…unlike your Facebook likes.
]]>I live in Seattle, so in particular I was looking for things I could do in Amsterdam that aren’t accessible in Seattle. And I really like food, so if I’m being honest, I was mostly interested in what I could eat in Amsterdam that I can’t eat in Seattle. So, step 1: collect reviews for all the restaurants in Seattle and Amsterdam. I fired up Helena and collected the reviews. See the GIF below for a look at that process:
I wanted to look for things that appear more often in the Amsterdam data than in the Seattle data. Looking at the prevalence of each word would be ok, but I figured that might obscure some interesting patterns, since some dishes would be multi-word strings. (For example, “rice table” turned out to be an interesting Dutch meal, and the string “rice table” appeared much more often in Amsterdam than Seattle, but “rice” and “table” were both about evenly represented in the two cities.) I didn’t want to just try every n-gram up to a given size since that sounded pretty slow. So I figured I’d use the fact that Yelp already makes an effort to highlight notable features about the restaurants on its platform. For instance, here are Yelp’s featured reviews for one of the Amsterdam restaurants:
Obviously this is a bit of a mixed bag. The featured reviews highlight two items - “rice table” and “coconut ice cream” - that definitely look like the kind of thing we want. But the third highlighted item, “different dishes,” seems a little vague. Still, this seemed good enough for my very casual purposes. So, step 2: collect the featured items from the featured reviews for all Seattle and Amsterdam restaurants. Here’s a GIF showing how I used Helena to collect these key phrases:
So now we have four datasets: reviews of Seattle restaurants, reviews of Amsterdam restaurants, key phrases from Seattle restaurants, and key phrases from Amsterdam phrases. I pooled the key phrases from the two cities to make one combined list of interesting phrases. Next, I calculated how many reviews from each city used each interesting phrase. That gives us the data below, showing the percentage of reviews by city that mention each phrase. This chart includes all the phrases for which 0.5% or more of reviews mentioned the phrase, in at least one of the cities.
Ok, so that one’s a little overwhelming. I didn’t get a lot out of that one. I mean, feel free to mouse over it and look at the prevalence of each phrase in each city. Apparently Seattle loves the word “crisp?” But basically, this was too much data. Let’s filter it a little more.
This is getting a little more reasonable. We can see individual phrases, and we can see that some things appear much more in one city or the other. Looks like “AMS” is pretty much just showing up in Amsterdam, not so much in Seattle; that’s the Amsterdam airport code, so that makes sense. But we’re getting a lot of phrases that actually have about the same incidence in both cities, and that’s not what I was seeking, so let’s try again.
Here we go. Now we’re charting the difference in incidence across the two cities. Above the line, the phrase appears more in Amsterdam reviews. Below the line, the phrase appears more in Seattle reviews. We’re seeing some good stuff here. Looks like Seattle likes “jus” - always thought that was weirdly prevalent here. “Ave” gets more play in Seattle. (Hello, The Ave! Hello, UW friends!) But it’s clearly time to zoom in on what we’re really seeking here: things that are much more prevalent in Amsterdam than in Seattle.
Here, at last, the key recommendations! Looks like we want to seek out: Euros (ok, we’ll need that to buy the food, fine); Dutch food (I mean sure, but that’s very vague, let’s get some deets); bitterballen (Dutch meatballs! yes!); canals (ok, not food, but I’m on board); Red Light District (…); Amstel (the canal? the beer?); Central Station (yeah, trains can get me to food!); rice table (a huge variety of Indonesian dishes in one meal! yes please!); rijsttafel (the Dutch word for rice table); Vondelpark (a very nice park, and I’m interested, but sadly not food); Leidseplein (hm, again a place, not food); poffertjes (traditional Dutch mini pancakes - sign me up!); Dam Square (not food, but yeah, you should probably go); Rembrandtplein (another good place to go; I guess you can eat on your way there or back?). Overall, definitely a bunch of stuff that is available in Amsterdam and not in Seattle! Success! Although I conclude that Yelp is not using its featured items to highlight only specialty dishes. Still, I’m not going to complain about being steered to the Rembrandtplein or the Vondelpark! So there you have it - a couple quick demonstrations, a few scraper runs, and you too can discover the local specialties at your next destination!
After hearing about this discussion, I figured the best way to get an answer was to get some data. Google Scholar seemed like a promising source. I’d been working on a Programming by Demonstration tool for web automation – the tool that I’d ultimately develop into Helena – so collecting data would be easy.
I queried Google Scholar Author Search for “label:computer_science” – the top authors tagged with the ‘computer_science’ label. Unfortunately, it turns out this is just a small slice of CS researchers; most authors aren’t tagged with ‘computer science’ but rather with subfield- or technique-specific labels. So I took a step back. Instead of collecting those authors’ papers and calling it good, I collected all their tags – which gave us a nice dataset of the subfield and technique tags that co-occur most often with ‘computer science.’ I sorted them by frequency, picked as many of the top labels as could fit in the search bar (66), and this query gave us our list of the top 10,000 authors. From there, it was just a matter of iterating through the top authors and, for each author, iterating through all papers.
Writing the programs for collecting this data with Helena takes about 3 minutes. Here’s how you do it:
Once I had the data, I had to operationalize peaking. I decided the key question was: how far into their careers do researchers publish their most-cited works? Essentially, we’ll say a researcher peaks at <year of most-cited paper> - <year of first paper>. Now clearly this isn’t a definitive answer to when the researcher peaks. There are many, many ways to operationalize peaking, but this was a pretty good proxy that I could extract from publication years and citation counts.
Ok! So let’s plot this. How many researchers peak 1 year into their publishing careers? How many peak at 2 years?
Well that’s looking pretty discouraging. As someone who hopes to be in CS research for a nice long time, that’s not what I’m hoping to see. There’s that spike right at 7 years, right around the time folks are getting their PhDs. Looks like that peaking-at-PhD faction had the right idea.
But of course this is not at all how we should plot this data. Turns out there are a lot of people who have pretty short publication careers. So what we’re seeing here reflects the fact that most of these authors will never have the chance to publish their most-cited work after year 30 because they’re not even publishing then.
Here are the career lengths of the top 10,000 most-cited authors in CS:
I actually think this data is pretty interesting all on its own.
Anyway, at this point I’m feeling some hope. Maybe that 7-year peak doesn’t come from researchers sticking around for 40 years and never recovering their early glory – maybe it’s there because not everyone bothers to stick around for 40 years. So when is that researcher with the 40-year career peaking?
And now those of us who want to do CS research long into the future can breathe a sigh of relief. In the above chart, each dot represents the number of authors who have a particular career length and peak – pale dots where there are few authors, darker dots where there are many. The black line represents the line of best fit. As we can see, the longer the career, the later the most-cited paper, on average. There doesn’t even seem to be a year beyond which influential work stops happening. Age and experience just keep helping!
If you want to read a little more about this data, we used it as an example in this paper: Browser Record and Replay as a Building Block for End-User Web Automation Tools. The paper discusses Ringer, our record and replay tool, and how we can use straight-line replay scripts to produce components for more complicated programs.